Lloyds Bank shares: two trend lines to follow
Shares in the high street lender have attempted to stage a recovery from multi-month lows, but a pair of trend lines muddy the waters. Here's what independent analyst Alistair Strang makes of it all.
19th October 2026 07:16
by Alistair Strang from Trends and Targets

Sometimes things can be better than they seem and, hopefully, our scribbles about Lloyds prove this shall be the case.
- Invest with ii:Open a Stocks & Shares ISA | Top ISA Funds | Transfer your ISA to ii
We’ve currently applied two main trends to Lloyds and, of course, it’s becoming difficult to ascertain which one shall prove “real”. The confusion around Lloyds' share price movements in relation to both the blue and red lines tends to confirm the market is also paying attention to history.
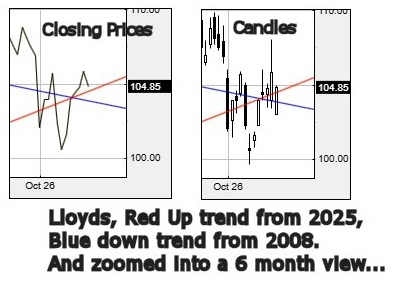
Source: Trends and Targets. Past performance is not a guide to future performance. Important: Trends and Targets charts only incorporate official share count consolidations, ignoring rights issues where investors have a choice as to whether to participate.
Let's deal with red first. The share broke red at the start of October, recovered a bit then broke downward a week later. But this second break lower included a gap down, then a gap up. This is something we’d generally take as priming for a bounce and, in the case of Lloyds, the share price indeed bounced and conformed rather exactly with our “GaGa” calculations.
In plain English, it went up by the correct amount when we judge the tiny little manipulation gaps (circled), the 4p bounce insignificant but proving the market was playing by the rules. We already felt this would be the case, the reversal to 100p on 8 October neatly in line with our previous prediction in September. It certainly appears red may be the important trend for us to watch.
However, there’s also the inconvenient blue downtrend, an 18-year-old piece of stupidity which should be ignored. But again, unfortunately the market also seems to be paying attention to this trend, the share price closing at 105.85p last week and returning itself above the silly long-term downtrend. We do concede it’s not often when the market is gifted two trend lines crossing, along with a perfect situation in which to muddy the waters. Our inclination is two take blue slightly more seriously than red.
In the event our blue scenario intends to pan out, above 107p should now trigger a rise to an initial 112p with our longer-term secondary, if bettered, calculating at 119p. These ambitions should prove pretty important, actually justifying the word “breakout” in the event Lloyds manages to close above the previous closing price high of 117p. The Big Picture allocates a future attraction coming from 152p in such a game plan.
Of course, red may hold all the losing numbers, especially as our 100p drop target was exceeded by 0.3p for a couple of seconds. This bothers us slightly as now, below 100p threatens to promote reversal down to an initial 95.5p with our secondary, if broken, a potential trampoline level at 91.3p
Interesting times.
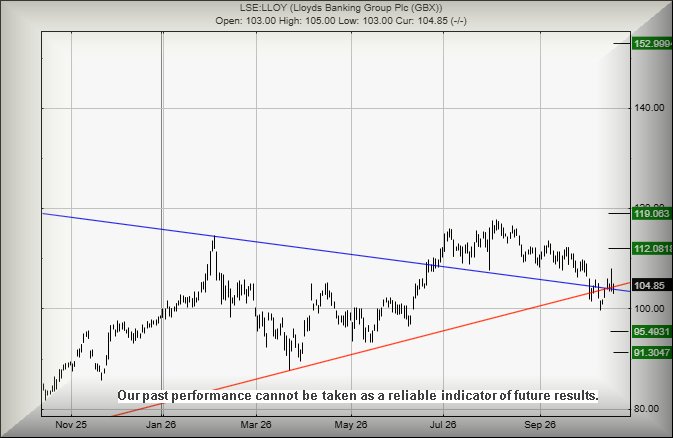
Source: Trends and Targets. Past performance is not a guide to future performance. Important: Trends and Targets charts only incorporate official share count consolidations, ignoring rights issues where investors have a choice as to whether to participate.
Alistair Strang has led high-profile and "top secret" software projects since the late 1970s and won the original John Logie Baird Award for inventors and innovators. After the financial crash, he wanted to know "how it worked" with a view to mimicking existing trading formulas and predicting what was coming next. His results speak for themselves as he continually refines the methodology.
Alistair Strang is a freelance contributor and not a direct employee of Interactive Investor. All correspondence is with Alistair Strang, who for these purposes is deemed a third-party supplier. Buying, selling and investing in shares is not without risk. Market and company movement will affect your performance and you may get back less than you invest. Neither Alistair Strang or Interactive Investor will be responsible for any losses that may be incurred as a result of following a trading idea.
These articles are provided for information purposes only. Occasionally, an opinion about whether to buy or sell a specific investment may be provided by third parties. The content is not intended to be a personal recommendation to buy or sell any financial instrument or product, or to adopt any investment strategy as it is not provided based on an assessment of your investing knowledge and experience, your financial situation or your investment objectives. The value of your investments, and the income derived from them, may go down as well as up. You may not get back all the money that you invest. The investments referred to in this article may not be suitable for all investors, and if in doubt, an investor should seek advice from a qualified investment adviser.
Full performance can be found on the company or index summary page on the interactive investor website. Simply click on the company's or index name highlighted in the article.