When might IAG shares bounce back?
Military conflict in the Middle East has shut down one of the British Airways owner's big profit centres, triggering a share price dive from multi-year highs. Independent analyst Alistair Strang reveals what his charts say happens next.
3rd March 2026 07:49
by Alistair Strang from Trends and Targets
In recent weeks, a few analysts have been pushing British Airways owner International Consolidated Airlines Group SA (LSE:IAG) as a “buy” with what they claim to be significant upside. However, thanks to the outbreak of hostilities in the Middle East, it no longer looks like any sort of sure thing, quite the converse in fact. With airspace closed due to Iranian attacks, an important profit centre faces loss of income until things are sorted out, a sharp balance against their recent record financial results.
- Invest with ii:Open a Stocks & Shares ISA | Top ISA Funds | Transfer your ISA to ii
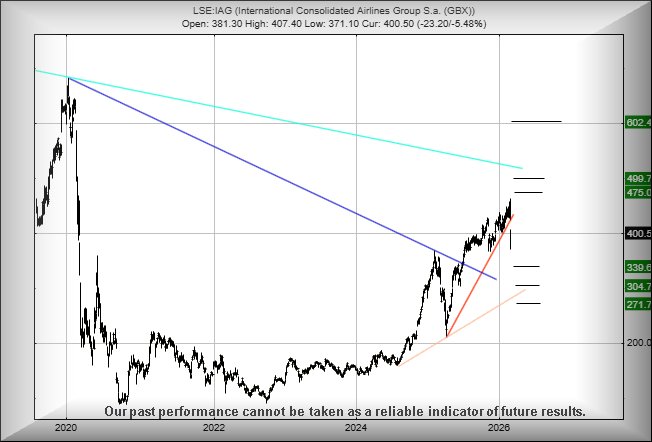
The harsh reality of the Iran war has dumped the share price below the immediate uptrend (circled) with some dangerous (or perhaps interesting) potential for further reversals. There are a couple of numbers worth keeping in mind as they’re going to assume some importance in the days/weeks ahead.
If the drop is going to give the first indication of it being a “fake”, above 426p shall be regarded as a fairly important signal to anticipate a cycle of gains.
Alternately, 344p – the Blue breakout level – should highlight the potential for further weakness in the share price, this appearing to be the immediate excuse for some concern.
Should the share price wander below 370p, reversal down to an initial 339p calculates as possible with our secondary, if broken, at a hopeful “bottom” at 304p. Visually, such a price level would establish an excellent point for a bounce, despite the Big Picture suggesting an eventual 271p could present itself as exerting an attraction. This scenario is obviously important, risking reversals below the critical 344p breakout level!
However, the share price ‘only’ needs above 426p to introduce a chance of happy days ahead, giving the potential to trigger a visit to 475p with our secondary, if exceeded, at 499p, the Big Picture claiming the value to be in the thrall of a distant 602p.
It is all a little bit confusing but we suspect IAG intends to bottom briefly at 339p.
Source: Trends and Targets. Past performance is not a guide to future performance.
Alistair Strang has led high-profile and "top secret" software projects since the late 1970s and won the original John Logie Baird Award for inventors and innovators. After the financial crash, he wanted to know "how it worked" with a view to mimicking existing trading formulas and predicting what was coming next. His results speak for themselves as he continually refines the methodology.
Alistair Strang is a freelance contributor and not a direct employee of Interactive Investor. All correspondence is with Alistair Strang, who for these purposes is deemed a third-party supplier. Buying, selling and investing in shares is not without risk. Market and company movement will affect your performance and you may get back less than you invest. Neither Alistair Strang or Interactive Investor will be responsible for any losses that may be incurred as a result of following a trading idea.
These articles are provided for information purposes only. Occasionally, an opinion about whether to buy or sell a specific investment may be provided by third parties. The content is not intended to be a personal recommendation to buy or sell any financial instrument or product, or to adopt any investment strategy as it is not provided based on an assessment of your investing knowledge and experience, your financial situation or your investment objectives. The value of your investments, and the income derived from them, may go down as well as up. You may not get back all the money that you invest. The investments referred to in this article may not be suitable for all investors, and if in doubt, an investor should seek advice from a qualified investment adviser.
Full performance can be found on the company or index summary page on the interactive investor website. Simply click on the company's or index name highlighted in the article.